I’m excited to share the first part of a deep dive I’ve been working on for the past two months (hence the lack of #content lately). Enjoy!
The ubiquity of plastic is hard to overstate. You might wake up, squeeze some toothpaste out of a polyethylene tube onto the nylon bristles of a polypropylene toothbrush, eat a breakfast of some cereal that comes out of a polyethylene bag and some milk that comes out of a polyethylene jug. You might also take some vitamins from a polyethelene terepthalate bottle, cook something in a polytetrafluoroethylene-coated pan, make coffee from a polypropylene Keurig cup, discard all these plastic items into a low-density polyethlyene plastic trash bag…the list goes on and on. We produce a massive amount of plastic. In 2020, the amount of plastic produced was roughly equal to the total mass of humans on earth. Imagine a you-sized (well, bigger due to density difference) plastic person being built every year of your life. Where will all these plastic people go? What’s the plan?

What is plastic?
Plastic is short for “thermoplastic,” which is only a subset of what we call plastics. It originates from Greek plastikos, meaning “fit for molding” (which it also still means). When we say plastic, we refer broadly to all synthetic polymeric materials: manmade materials composed of repeating molecular units. It’s typical to consider plastics in two categories: thermoplastics vs thermosets, or resins vs fibers.
| Thermosets | Once solidified, cannot be melted down and resolidified ~10% of current plastic production (SA) | Epoxide (EP) Phenol-formaldehyde (PF) Polyurethane (PUR) Unsaturated polyester resins (UP) |
| Thermoplastics | Can be repeatedly melted down and resolidified ~90% of current plastic production (SA) | Acrylonitrile butadiene styrene (ABS) Polycarbonate (PC) Polyethylene (PE) Polyethylene terephthalate (PET) Polytetrafluoroethylene (PTFE) Polyvinyl chloride (PVC) Polymethyl methacrylate (PMMA) Polypropylene (PP) Polystyrene (PS) Expanded Polystyrene (EPS) |

Qualities you might associate with plastic are:
- Elastic
- Smooth
- Lightweight
- Colorful
- Waterproof
Bakelite, invented in 1907, is commonly said to be the first plastic. It’s actually the first fully synthetic plastic. We might consider celluloid, invented decades earlier, in 1869, to be the first plastic, though not fully synthetic because it’s a modification of a natural polymer, cellulose. Yep, the polysaccharide in cell walls that makes wood hard and paper bendy.
Celluloid was invented, as so much was back then, by some guy with no chemistry background (John Wesley Hyatt) experimenting with an explosive (nitric acid + cotton) in his backyard. Cotton is mostly cellulose, which he converted to nitrocellulose and then mixed with camphor to make celluloid.

But actually, we can trace the invention of celluloid another seven years back to 1862: the original celluloid “parkesine”, invented by the English Alexander Parkes (Painter 2008). Oh, to be a professional inventor in the 19th century. No chemistry education, no fume hoods, just you, your explosives, and your seventeen children for moral support.
Anyway, a large motivation for Hyatt to continue work on celluloid was that elephant populations in Africa were getting decimating to make billiard balls in America and Europe. Not out of concern for the elephants, of course, but out of the lucrative potential of swooping in with a cheap alternative. Celluloid ultimately made its mark as photographic film instead, where it was later replaced by the less-flammable polyester). Today, celluloid is still used for some things like ping-pong balls and guitar picks.


Fig. 4. Guitar pick made of celluloid that looks like tortoiseshell (Wikimedia)
How is plastic made?
Since then, countless such stories of invention and application have occurred, leading to the ubiquity and complexity of plastic products that the average consumer doesn’t think twice about today. We generally don’t rely on the cellulose in plant material to provide the backbone of our polymers—we convert petroleum into monomers and then react them to form polymers, often with catalysts and at high pressures at temperatures. You can learn more about polymer chemistry here.

Although the diagram above shows that polystyrene is made of only carbon and hydrogen, plastics often contain other stuff. Additives are mixed in to improve various properties of plastics. They can be grouped into:
- Functional additives (stabilizing, antistatic, flame retardant, plasticizer, lubricant, curing, foaming, biocides, etc. Ex. phthalates, phenolics, BPA, metallics, heavy metal compounds)
- Colorants (pigments, soluble azocolorants, etc)
- Fillers (minerals like mica, talc, clay, calcium carbonate, barium sulfate, etc)
- Reinforcements (glass fibers, carbon fibers, etc)
Depending on the plastic, additives could make up anywhere from a fraction of a percent to 70% of the total weight. Importantly, additives are almost never actually chemically bound to the plastic polymer itself, which is partly why leakage into the surroundings is a concern.
You’ve probably heard of bioplastics. They make up a negligible quantity of all plastics produced, but I’ll discuss them in Part II.
Plastic Production, Use, and Disposal
Let’s hit the statistics. What’s going on today?
(Remember when I made those posts about world and U.S. energy use? The minor difficulties I had with getting data for those posts are a joke compared to plastics data. Energy is very well known compared to plastics.)
My main sources are:
- The IEA’s 2018 “Future of Petrochemicals” report
- PlasticsEurope’s 2021 Annual Report
- Roland Geyer et al. 2017 “Production, use, and fate of all plastics ever made”
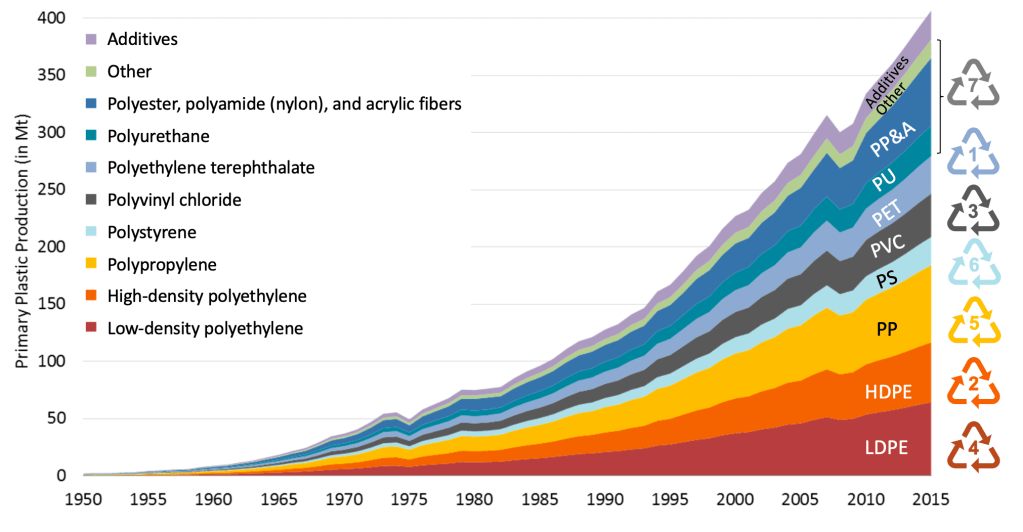

A veritable rainbow of polymers are produced, with no one greatly dominating. When it comes to the use purpose, however, there’s a standout: about 37% of all primary plastic produced in 2015 was used for packaging.
To further relate use and type, take a look at my next plot.
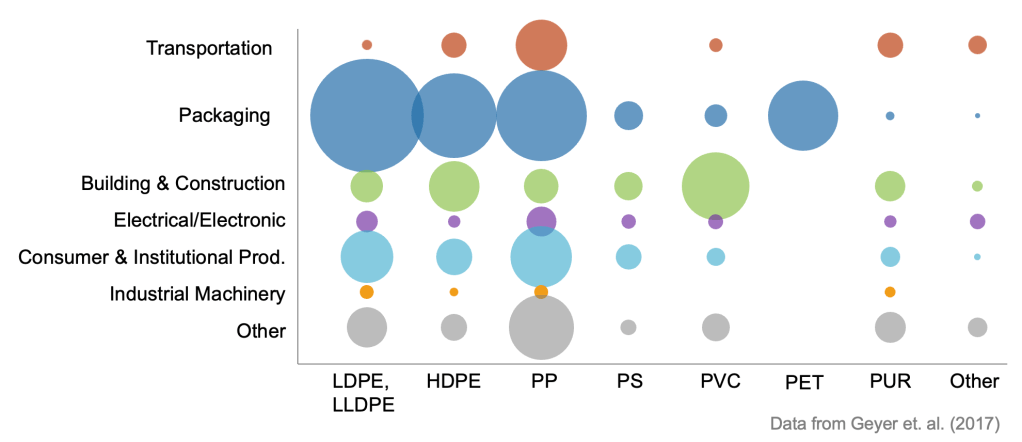
Here we see that LDPE, HDPE, PP, and PET make up most of packaging, and packaging makes up most of LDPE, HDPE, and virtually all of PET. Almost all of PVC goes to building and construction.
Plastic to waste
Waste is even harder to estimate than production, because while it makes sense to track the production of products entering the market, nations don’t exactly weigh and analyze their plastic trash. The Geyer paper uses the common approach of log-normal distributions of product lifetimes to estimate when different types of plastic products become waste.

I scaled the figures below so that you can see that the flows of plastic being created and discarded are similar. Geyer estimates that in 2015, we’re throwing away about 75% as much plastic as we produce on a yearly basis (Another highly cited paper by Jambek et. al. estimated, for 2010, waste exceeding primary producing at 275 vs 270 million metric tons).


This isn’t to say that the difference in the area covered by the production and waste curves will never become waste, but rather that it just hasn’t yet become waste. While plastic packaging is thrown away very soon after it is produced, plastics like PVC pipes in buildings may be used for many decades before they become trash. This is incorporated into the Geyer model by the product lifetime distributions (Fig. 10), where you see that building and construction products have an average lifetime of about 34 years, versus packaging around 1 year. This directly resulting in the shrinking green “construction” portion in Fig. 11, which is responsible for most of the difference between the production and waste graphs. We can further corroborate this with Fig. 8, where we see that PVC is the main plastic used in construction, and across the top row of Fig. 11, where we see a noticeable thinning of the PVC portion.

Where does plastic waste go?
Turns out what’s even harder to track than the quantity of plastic waste is where it goes. Jambek estimated that in 2010, 32% of the plastic generated by 93% of the global population was mismanaged (scattered to the natural environment), and 15-40% of that mismanaged waste entered the ocean.
By roughly applying those figures (and taking the average of 15 and 40%), as well as Geyer’s incineration and recycling percentage estimates, I got this:

Although the uncertainty is pretty big, I think this is a helpful visualization of some of the most widely cited data. Don’t forget that recycling is not circular: it’s just a delay in the trip to the graveyard. So, if we were to look only at the final destinations of plastic waste, we get this:

This begs the question: what are the differences between these destinations? Why do plastics go to the destinations they go to, and what are the consequences?
Part II will cover plastic pollution, degradation, biodegradation, incineration, and recycling—stay tuned! And in other exciting news, just two days ago, UNEP passed a “historic resolution” about plastic pollution.
Discover more from evoiding
Subscribe to get the latest posts sent to your email.

Hi Emily,
I recently dove into the deep hole that is attempting to understand plastics and their usage. This is easily the best written piece I have read so far about the topic. I know this post is from almost 4 years ago, but I would love to get to read pt2 if it’s something you are still thinking about finishing!
-Joel
LikeLike