I think it’s important to know some basic facts about energy. Here are the five favorite figures I’ve collected for this, some made by me.
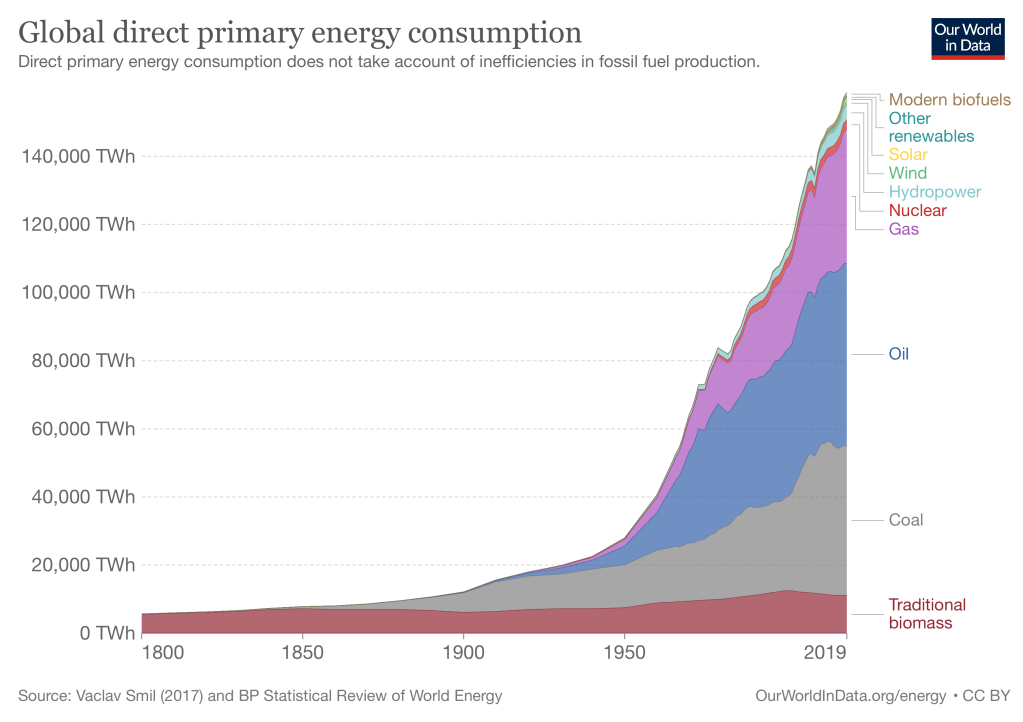
1: Global primary energy consumption by source[1]
World energy consumption has increased dramatically in recent history, a trend that’s more exponential than linear. There’s an ~800% increase since 1950, mainly from fossil fuels. Hydropower is the biggest (but also most limited) “clean” renewable, while solar is nearly invisible.
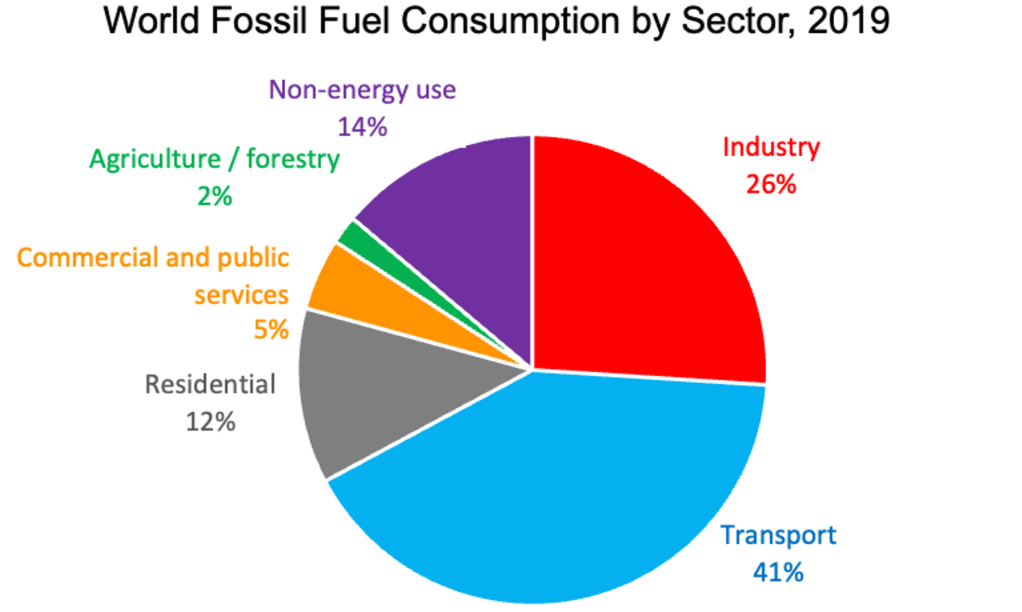
2: World fossil fuel consumption by sector
If we are to transition away from fossil fuels, it would be good to know what they are currently used for. It was helpful for me to figure out what these categories really mean. They are defined in detail by the IEA documentation for this data, which gives lists of U.N. ISIC classes of economic activity for each.
- Transport (41%) is cars, trucks, trains, ships, planes, etc., powered mostly by oil.
- Industry (26%) means fossil fuels used to provide energy for industry, like powering equipment and heating furnaces.
- Non-energy (14%) follows, which refers to when fossil fuels are used as feedstock, not fuel: for example, natural gas is used to synthesize ammonia and crude oil is used to make plastics.
- Residential (12%) includes heating, cooking, and household electricity.
- Commercial and public services (5%) is an expansive category including water, sewage, waste management, landscaping, car repair, restaurants, and more.
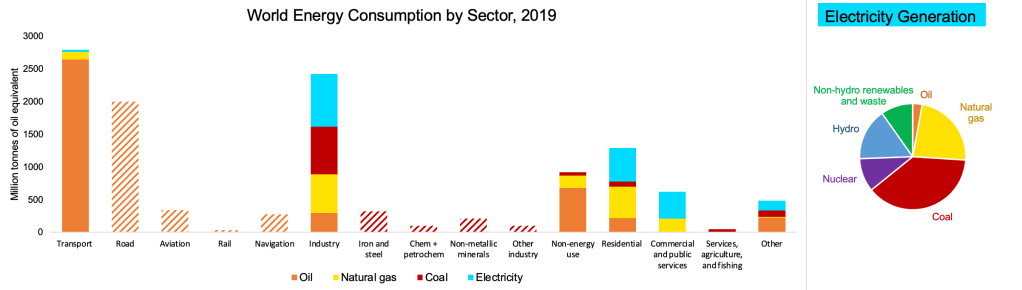
3: Global energy consumption by source and sector
This graph I made from of IEA data answers a lot of questions in one picture, breaking down the world energy mix in each sector, measured in MTOE[2] this time. For transport and industry, I also show in striped bars the main sub-sectors consuming the largest source. What I like about this figure is that it lets you compare a lot of different things: for example, we see that the amount of coal energy used to make iron and steel just over that of all the oil used for aviation. Takeaways: oil powers virtually all transportation, while a more even mix of fossil fuels (skewed towards coal) is behind industry. A considerable chunk of oil is used for non-energy purposes. Residential, commercial, and public service needs are provided for mostly by natural gas and electricity. I’m not sure why the IEA tabulates electricity as a “source” along with coal, oil, and gas, so I include a pie chart to show where that electricity is sourced from: mostly coal. I would have liked to break it down by electricity generation source within each sector, but that data isn’t available (at least not in the free IEA file).
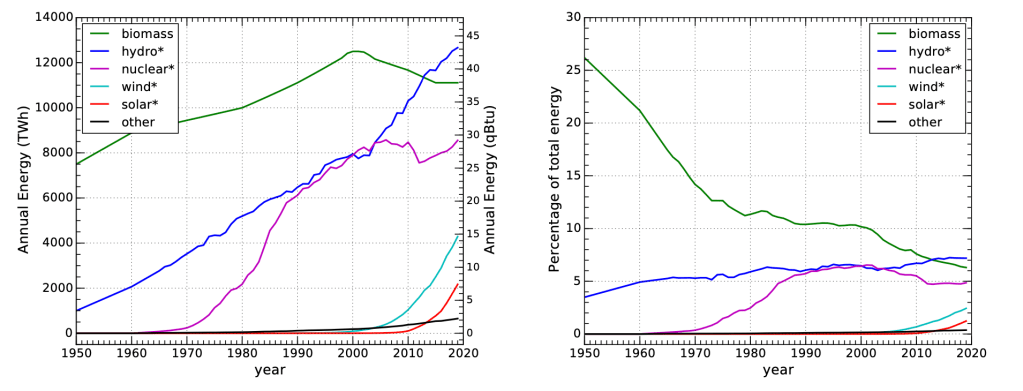
4: Global non-fossil energy consumption since 1950[3]
This figure is from the Murphy textbook (data from Smil[4]) and shows both the total annual energy (in yet another unit, terawatt-hours) and percentage of total energy share accounted by various alternative energies. It’s like a zoomed-in version of the tiny slices on the top of the first plot. Here, a key takeaway is that biomass (e.g. wood) is still the second largest source of renewable energy. We also see renewable energy has not grown very much as a percentage of total energy in past decades. Hydro creeps along around 7%, while nuclear is plateauing around 5% and solar and wind have grown to merely 1% and 2% respectively.
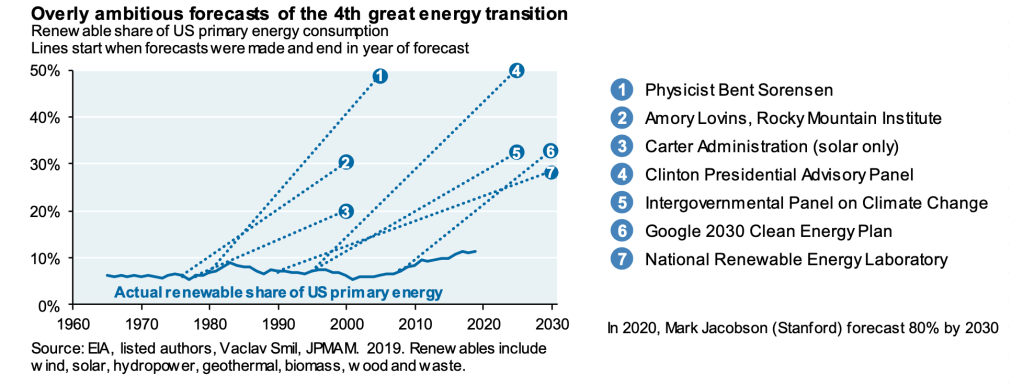
5. Overly ambitious forecasts of the 4th great energy transition[5]
This figure is a sobering look back on forecasts from knowledgeable people that have vastly overestimated the rate of the renewable transition. It’s a good reminder that it is all too possible to be all too optimistic about the state and trajectory of transition. To smoothly transition away from fossil fuel dependence under twin mounting pressures of ecological destruction and dwindling fossil fuel supply, unprecedented change must happen.
[1] Global direct primary energy consumption. Our World in Data https://ourworldindata.org/grapher/global-primary-energy.
[2] MTOE is “million tonnes of oil equivalent,” a unit of energy equal to about 42 petajoules. In this figure, non-energy uses of fossil fuels are also measured in MTOE: the amount of energy you would have gotten from these if you burned them as fuel.
[3] Murphy, T. W. Energy and Human Ambitions on a Finite Planet. (2021) doi:10.21221/S2978-0-578-86717
[4] V Smil. 2017 Energy Transitions: Global and National Perspectives. Also incorporates data from the BP Statistical Review of World Energy. https://ourworldindata.org/energy
[5] Cembalest, M. 2021 Annual Energy Paper. https://am.jpmorgan.com/content/dam/jpm-am-aem/global/en/insights/eye-on-the-market/future-shock-amv.pdf (2021).
Discover more from evoiding
Subscribe to get the latest posts sent to your email.

2 comments